Issue #67 - 2018 in Review

Our 2018 IMI kick off was entitled ‘The Year of the Bubble’ in which we discussed our growing concerns regarding the ‘Everything Bubble’ in which stocks, bonds, real estate, bitcoin, and pretty much every other investable asset class was overpriced.
During the first few months of the year, it seemed as though 2018 was going to continue blowing air into these bubbles, particularly US stocks. Then came the US-China Trade War, the aggressive interest rate increases by the Federal Reserve, and reports of a global economic slowdown. Very quickly, the fortunes reversed and most markets around the world posted double-digit drops by the end of the summer. Only the US market managed to stay in the black up until that point.
That’s when the bloodbath started. From August 29th to December 21st, the US S&P500 market dropped 21.9%, crossing the 20% decline threshold required to be considered a ‘bear market’. To put that into perspective, this 4th quarter drop puts it in fine company behind only the Great Depression, 1987’s famed Black Monday, and the 2008 Global Financial Meltdown. Capped off by the worst Christmas Eve in the history of the markets, December appears to have been one of the worst months on record for the last 70 years.
By some measures, 2018 will have been the worse investment year on record given that almost every asset class lost money! According to Deutsche Bank, 93% of all potential investable assets in the world will have posted negative returns for the year1. However, despite these losses the US market still finished ahead of many of its peers thanks to the substantial gains in the first few months of the year.

With this backdrop, we turn our attention to what happened and where do we go from here?
What happened?
It is always easier to see the causes of a market correction with the benefit of a few years of hindsight. In our opinion, the recent market volatility was primarily influenced by the following factors:
- The Federal Reserve continuing to increase interest rates despite signs of a slowing economy, political gridlock, and a hostile President.
- The Trade War with China coming at a time when the Chinese economy is trying to modernise and reduce its dependence on debt to fuel growth.
- Exchange Traded Funds, Quant traders, and AI powered investment recommendations all pushing the ‘sell’ button at the same time without looking at the fundamentals of what they are invested in.
Many of these issues are man-made and not the result of a normal economic cycle. Frustratingly, this factor has been the cause of most recessions and corrections of the past hundred years, as seen in the chart below:
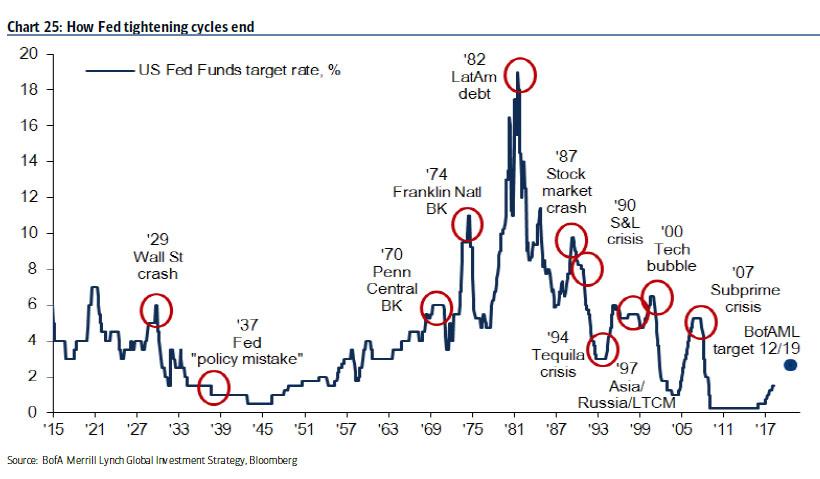
This chart represents the lending rate of the Federal Reserve which is controlled by an independent banking committee. As shown, most corrections occurred directly after aggressive periods of interest rate increases. Bank of America Merrill Lynch expects rates to continue their ascent to almost four percent before reaching the ‘breaking point’ in December 2019.
There are two other causes however that are more worrisome and cannot be addressed quite so easily.
Household Debt
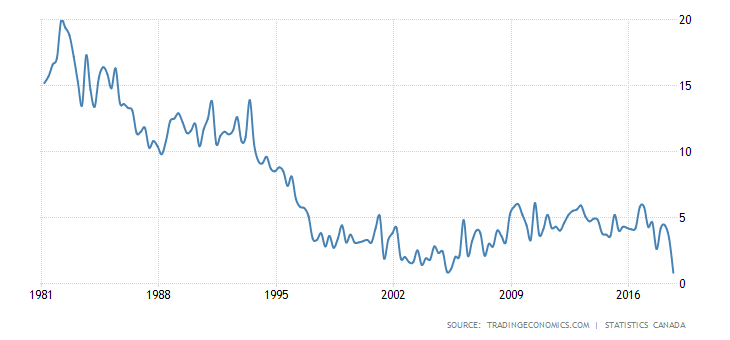
The first, household debt, is particularly prevalent in Canada where most of us never got the memo from the 2008 crash that housing pricing don’t always go up. This lapse has led to a massive surge in borrowing, both in the form of secured (against the home) and unsecured (credit cards, lines of credit, etc) debts. As interest rates continue to rise, the cost to service this debt will rise along with it and squeeze an already tapped out consumer. Just how tapped out is the average Canadian household? From 1981 to 2018, personal savings averaged 7% of income2. At last reading3, personal savings had plummeted to 0.8% and are rapidly approaching the negatives in which the average Canadian gets poorer every year…
The following two charts illustrate average Canadian household savings and debt, respectively. When compared, they reveal just how precarious the situation is for Canadians in an environment where interest rates are set to rise.
Figure 1 - Canadian Household Savings Rate
Compare this chart with the average household debt compared to income and you get the picture of just how precarious things for Canadians in an environment where interest rates are set to rise.
Figure 2 - Canadian average household debt to income
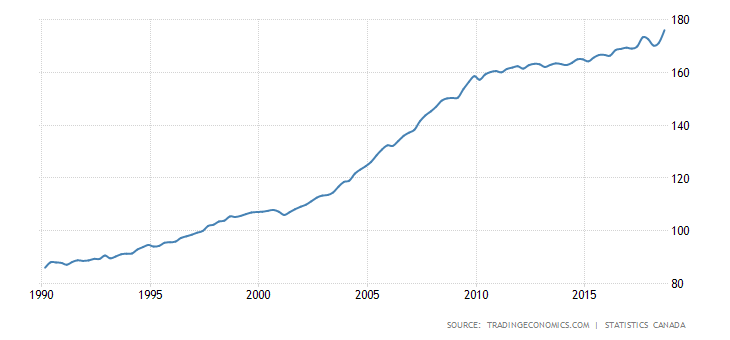
Yes, you are reading that correctly. The average Canadian now has debt levels equivalent to 175%+ of their household income compared to 85% in 1990.
Even the slightest increase in interest rates has sent the average Canadian's households balance sheet out of balance. As can be seen in the chart below, most of us are now paying a great deal more interest than principal on our debts, a scary proposition.
Figure 3 - Debt Service Payments Principal vs Interest
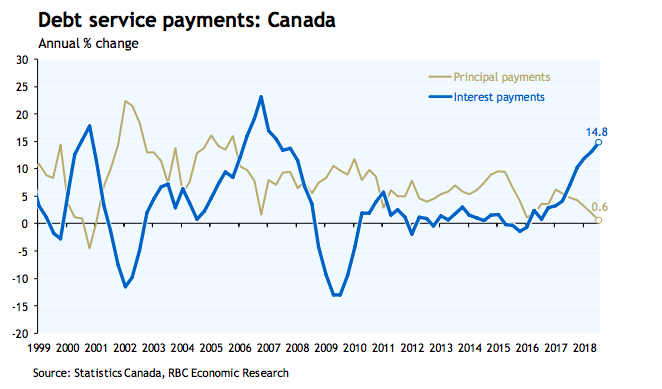
What happens to a consumer based economy when consumers have no more money to spend?
Fortunately, a great deal of these issues can be ‘diversified’ away by allocating investments outside of Canada. We continue to advocate a well-diversified portfolio that maintains a strong element of capital protection.
Corporate Debt
Just like their Canadian counterparts, U.S. and international companies have greatly benefitted from the ultra-low interest rates set by central banks around the world and binged on the cheap money. In Europe, the European Central Bank became so desperate to stimulate the economy that they lowered interest rates into the negatives, effectively punishing savers!
Naturally, this trend led companies to borrow as much as they possibly could. In many cases, these same companies had no real place to invest those proceeds and thus simply returned the money to shareholders in the form of dividends and share buyback programs. Now that the stock market has dropped considerably from their highs, these companies are still on the hook for these debts while the short term stock bump spurred by the buybacks have gone up in smoke, at least in the near term.
Take Apple for example. Throughout 2018, it began to systematically buy back almost $80 billion of its own shares, effectively eliminating them from circulation. In an open market based on supply and demand, this buyback temporarily increases the demand while reducing the amount of shares on offer. However if those shares are purchases at $200 per share and the share price later drops 25% to $150, then it can be argued that Apple effectively wasted 25% of $80 billion or $20 billion dollars of company capital on this share buyback.
In a nutshell, this example is exactly why the Trump tax stimulus package boils down to a tax handout to the wealthy. In a perfect world, reducing corporate tax rates leads to increased cash flow to companies who put that money to use investing in new production, research and development, hiring, etc. Unfortunately, most companies in the U.S. did not spend these dollars in that capacity and rather simply used the funds to buy back their own shares. U.S. share buybacks hit an all-time high in 2018, surging more than 58% higher than 20174. This trend may help explain the U.S.’ outperformance when compared to other foreign markets.
The buyback of shares overwhelmingly benefits those who already own a great deal of shares in these companies. As such, the tax cuts that reduced the ability of the U.S. government to balance its budget in hopes of stimulating the economy instead helped fuel an already inflated stock market bubble, much like a confused Robin Hood robbing from the masses to pay the ultra-rich. I am all for tax reform and reducing the burden on individuals and companies, but not if the end result simply pushes up an already inflated stock market (on a historical price to earnings basis5) for six months.
Even more worrying, companies have shown a propensity to buy back stock at the absolute worst times, as can be seen in the chart below.
Figure 4 - US Stock Market Share Buy-Backs
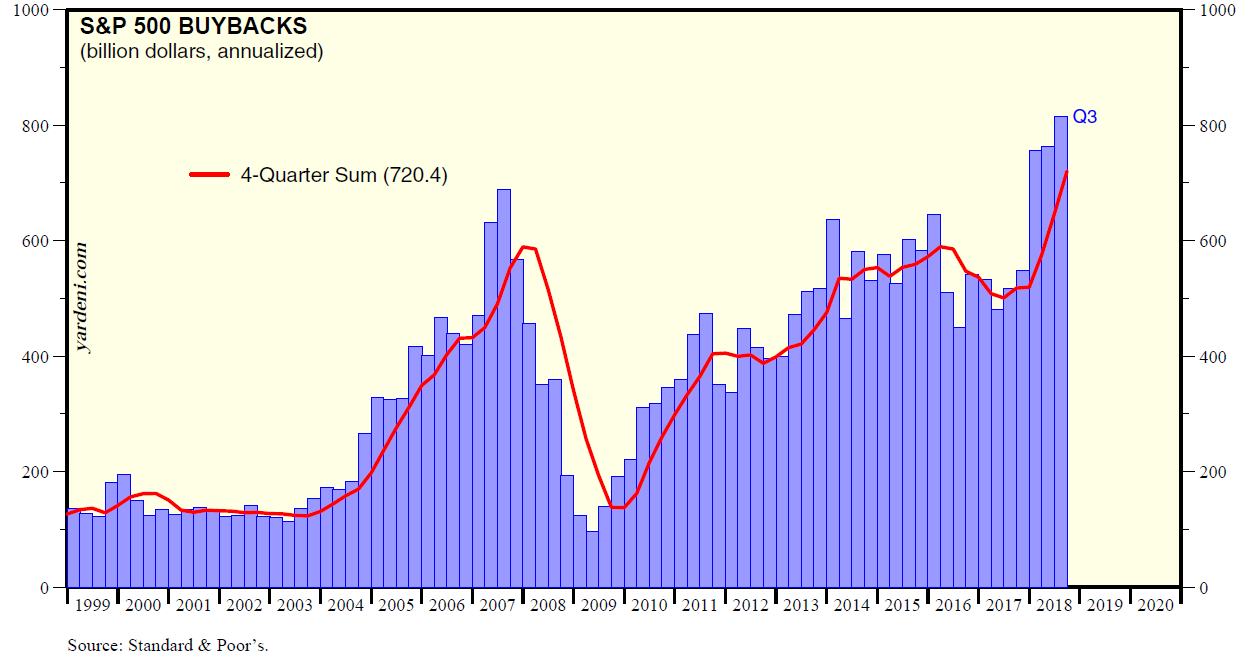
The world of Wall Street has truly turned to ‘what have you done for me lately’ and so many company executives have turned to borrowing money at cheap rates and then buy back their own shares to boost stock prices, keep shareholders happy, and make their bonuses.
But what are the long term consequences of taking on all that debt, only to waste it away by buying up a stock at its peak price?
Now we reach the chart that scares me most of all – the corporate debt wall!
Figure 5 - US Corporate Bonds Maturity Dates
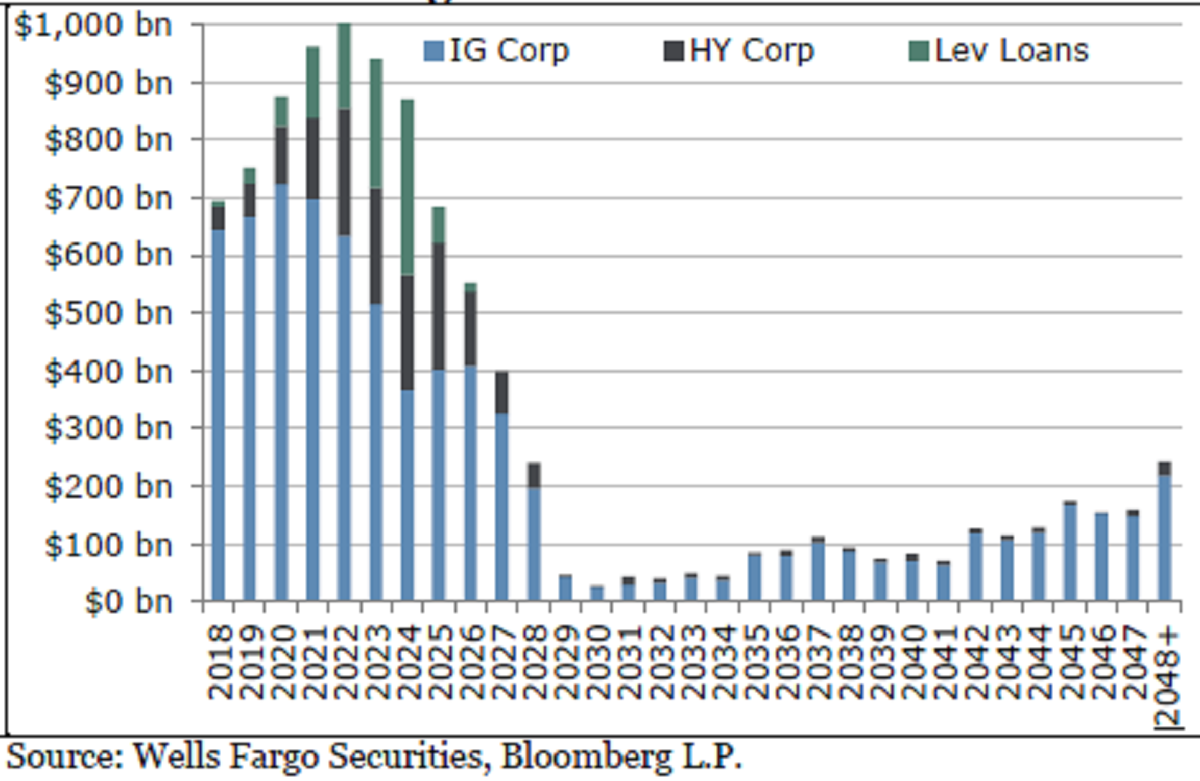
The chart above shows the maturity dates of U.S. corporate bonds, which is effectively the date when the bankers and investors come calling for their principle back. As you can see, we are coming up on a substantial spike in the value of bonds set to mature at a time when interest rates are set to rise and the economy is slowing down. This development is the perfect storm for any company that does not have their financial house in order and will likely lead to some substantial corporate defaults. We are already starting to see some former giants that have been limping by on cheap money, like Sears, filing for bankruptcy as they are unable to refinance loans.
A company that is unable to service its debt by means of its profits is known as a ‘Zombie Firm’. It’s reliance on new and cheaper forms of financing essentially cause it to become the walking dead. According to the Bank of International Settlement as many as 12% of companies meet this definition and are very susceptible to bankruptcies triggered by an inability to refinance existing debts when the going gets tough.
In the wise words of Warren Buffett, “A rising tide may lift all boats, but it is only when the tide goes out that you discover who has been swimming naked”.
Where do we go from here?
It is important to remember that the markets are coming off almost a decade of uninterrupted positive returns and by many measures, had become overvalued. We have shared this concern with you several times over the past year, but it bears repeating as this recent drop does not necessarily signal to us that the time to ‘buy low’ has arrived. By our estimation, this brings stocks in the US back to historical fair market value – hardly the bargain bin shopping we strive to deploy cash into.
There is also the matter of timing. On December 26th, the first day the markets reopened after the ‘Mnuchin Massacre’ of December 24th, they shot straight through the roof in one of the market’s biggest single daily increases of the year. Since the 2008 financial crisis, the world economy has been on life support with the Federal Reserve and other central banks artificially lowering interest rates to stimulate the economy.
Confident that things are returning to normal and that the patient is gaining strength, the central bankers, or ‘care providers’, have begun easing the economy off life support by normalizing interest rates. As any good doctor will tell you, an important signal of health is stable vital signs. A stock market that posts ‘worst single day drop’ one day and ‘biggest daily gain’ the next, is hardly the poster boy of health. Moreover, these false starts are often harbingers of worse things to come.
The following chart shows the days in which the US Stock Market gained 5% or greater.
Figure 6 - Days when the S&P500 Gained 5%+
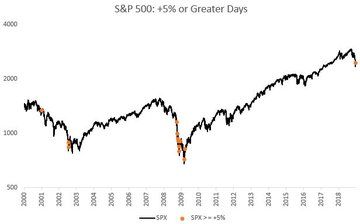
As you can see, these days typically occurred on the way down, not on the way up… For this reason, we continue to recommend caution at this point. We will be recommending modest allocation increases to stocks over the coming weeks for clients for whom the risk tolerance is suitable, while still recommending a healthy amount of capital on the side lines.
Things we may see in 2019 (Hypothetical and not to be construed as a trade recommendation)
- Continued stock market volatility
- U.S-China trade war put on the back burner
- Pipeline activity restarts in Canada ahead of the 2019 elections.
- Moderate correction of the housing market in major Canadian urban centers as consumers begin to lose confidence in the market, similar to the U.S.
- At least one large U.S. company files for bankruptcy after failing to refinance their debts.
- High yield and investment grade bonds post losses for second consecutive year in the face of rising rates and deteriorating credit quality.
As you can see, we are light on optimism for the time being. That said, stock market valuations have begun to appear more reasonable and appealing and so investors with long term time horizons may want to consider allocations.
Alternative strategies, private equity, infrastructure, closed-end real estate positions and other uncorrelated securities that offer a liquidity premium may also be suitable for these same long-term oriented clients. All the while, cash and cash alternatives will remain an important piece of the investment puzzle.
As 2018 has shown, a defensive posture can help protect capital during down markets. We do not expect the first half of 2019 to provide much relief in that regard but will continue to monitor the markets for buying opportunities!
Sources
1 https://www.zerohedge.com/news/2018-12-21/2018-officially-worst-year-record-93-all-assets-down
2 https://tradingeconomics.com/canada/personal-savings
3 https://tradingeconomics.com/canada/personal-savings
5 https://www.thestreet.com/investing/stocks/stocks-are-expensive-right-now-goldman-sachs-14713765
Innova Wealth Management is a trade name of Aligned Capital Partners Inc. (ACPI). Jean-François Démoré, as an agent of Innova Wealth Management/ACPI is registered to provide investment advice in the provinces of Ontario, Quebec, and British Columbia. Investment products are provided by ACPI, a member of the Investment Industry Regulatory Organization of Canada (www.iiroc.ca) and the Canadian Investor Protection Fund (www.cipf.ca). All non-securities related business conducted by J-F Demore as a representative of Innova Wealth Builders is not covered by the Canadian Investor Protection Fund and is not under the supervision of ACPI. No part of this content should be construed as investment advice.
The information contained herein was obtained from sources believed to be reliable, however, we cannot represent that it is accurate or complete. This report is provided as a general source of information and should not be considered personal investment advice or solicitation to buy or sell any securities mentioned. The views expressed are those of the author and not necessarily those of ACPI.
- Hits: 2355